Technology Adoption Curve: Metrics to Track at Each Stage
Explore the Technology Adoption Curve and key metrics to measure user engagement and growth at each stage, from innovators to laggards.
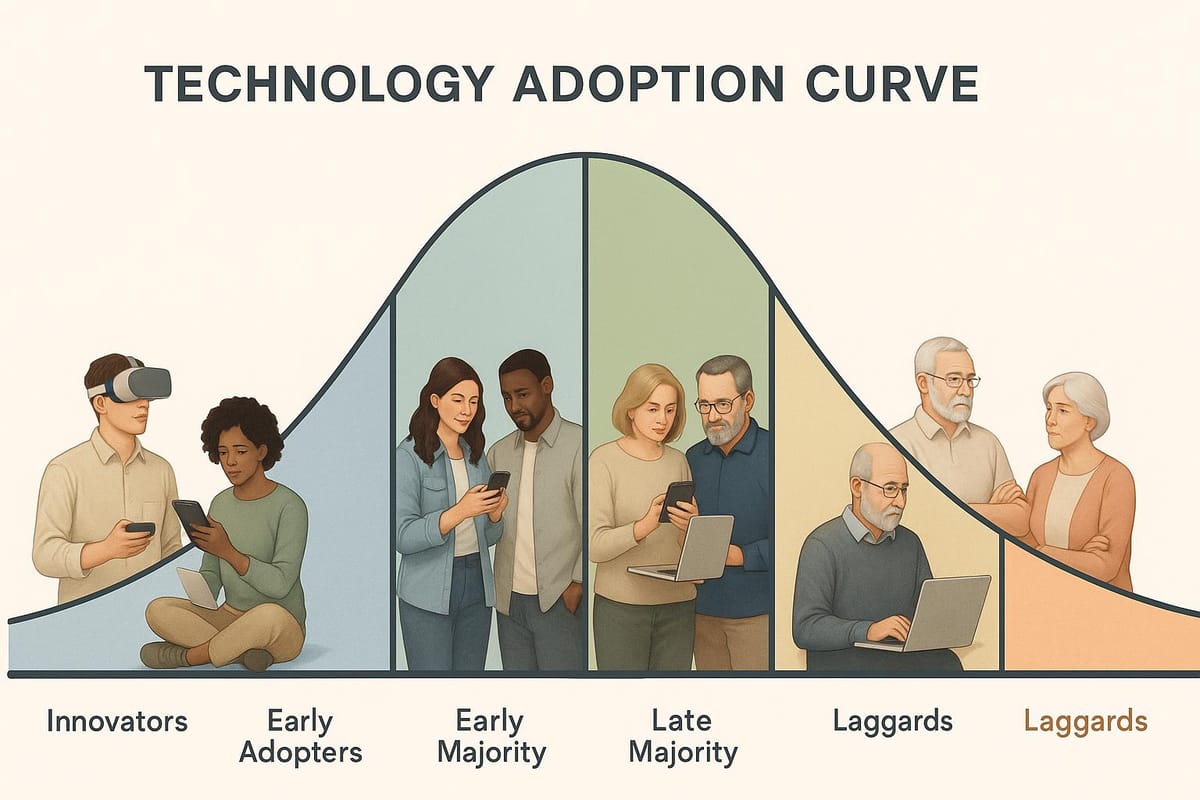
The Technology Adoption Curve explains how users adopt new products in five stages: Innovators, Early Adopters, Early Majority, Late Majority, and Laggards. Each group has unique behaviors, and tracking the right metrics at every stage is key to driving adoption and improving your product. Here's what to focus on:
- Innovators (2.5%): Track Time to Value (TTV), feature usage, feedback quality, and beta participation rates to refine your product early.
- Early Adopters (13.5%): Monitor activation rates, retention, churn, and Net Promoter Score (NPS) to validate market potential.
- Early Majority (34%): Focus on adoption velocity, cross-departmental usage, and product-market fit to scale.
- Late Majority (34%): Measure support efficiency, training success, and cost justification to address hesitancy.
- Laggards (16%): Track compliance rates, transition timelines, and legacy system dependency to manage mandatory adoption.
Each stage requires tailored strategies and metrics to ensure smooth transitions and long-term growth. Start by identifying where your users fall on the curve and use the right data to guide your product decisions.
Technology Adoption Lifecycle - Explaining the Saas Bell Curve
Stage 1: Innovators - Tracking Early Experimentation
Innovators make up just 2.5% of the market, but their impact is anything but small. These tech-savvy risk-takers are the first to dive into new products, embracing bugs and missing features without hesitation. Their willingness to experiment provides crucial insights during the early stages of product development. However, their enthusiasm is often short-lived - they’re quick to move on to the next shiny thing. This means their behavior doesn’t necessarily reflect the broader market, making it essential to track the right metrics to fully understand their contributions.
Key Metrics for Innovators
- Time to Value (TTV): This measures how quickly innovators find value in your product. Unlike later adopters who might need detailed onboarding, innovators prefer to explore independently and uncover functionality on their own. A short TTV suggests your product’s core features are intuitive and impactful.
- Feature Usage: Observing how often innovators engage with specific features and how deeply they interact with them can help pinpoint what’s working and what needs improvement. Their usage patterns often highlight areas that deserve more attention in development.
- Feedback Volume and Quality: Track the amount and depth of feedback innovators provide. Whether through surveys, beta testing, or direct communication, their input - such as detailed bug reports or feature suggestions - can be a goldmine for actionable insights.
- Beta Participation Rate: This shows how many of the innovators you invite actually engage with early-access programs. A high participation rate indicates effective recruitment and a strong interest in your product.
Using Innovator Metrics for Product Development
The insights gathered from innovators are invaluable for refining your product before introducing it to a wider audience. Their feedback helps shape updates and improvements that cater to the next market segment - the early adopters, who expect a more polished experience but still appreciate innovation.
Take inspiration from companies like Figma and Asana, which have effectively used beta testing and structured feedback to enhance their products. By releasing an early version to innovators, you can test your product’s core concepts without needing to achieve the level of perfection required for broader market acceptance. Offering incentives, like exclusive access or special perks, can encourage innovators to engage deeply with your product during this phase.
For example, DHL’s Parcelcopter project benefited greatly from customer collaboration, resulting in an impressive 80% satisfaction rate and 97% on-time delivery performance worldwide. This kind of early engagement can lead to transformative solutions that set your product apart.
To keep innovators engaged, consider creating exclusive beta groups, hosting private webinars, or offering direct access to your product team. Structured feedback sessions can provide the clarity needed to refine your product and prepare it for early adopters. In fact, 54% of companies report that a strong customer engagement strategy significantly influences innovation during the early stages of development.
Stage 2: Early Adopters - Validating Market Potential
After the experimental phase led by innovators, early adopters step in to validate whether a product has real market demand. Their strategic use of new technology often determines if it can bridge the gap to mainstream users.
Early adopters make up 13.5% of users [3] and play a pivotal role in this transition. These individuals are visionaries, drawn to products that offer competitive advantages. They’re willing to tolerate minor flaws if they believe the product can solve meaningful business challenges. Their endorsement often signals strong market potential, making them invaluable to early-stage growth.
As Everett Rogers highlights, early adopters are often central figures in their networks, making their influence crucial for driving broader adoption.
Core Metrics for Early Adopters
Understanding early adopter behavior requires tracking key metrics that reflect their engagement, satisfaction, and impact:
- Activation Rate: This metric serves as a primary indicator of product-market fit. Products that achieve activation rates above 60% among early adopters are often on a promising path. For SaaS companies, successful feature adoption typically falls within the 40–70% range [3].
- Retention and Churn Patterns: Retention rates provide insight into how well the product delivers sustained value. For early adopters, churn rates often range between 20–30%, depending on product maturity. Analyzing retention over 30-, 60-, and 90-day intervals can help determine whether your product holds users’ interest beyond initial exploration.
- Feedback-to-Action Ratio: Early adopters dedicate time and effort to providing feedback. Measuring how much of that feedback is turned into tangible improvements can directly impact their satisfaction and willingness to advocate for your product.
- Net Promoter Score (NPS): When measured specifically among early adopters, NPS can reveal how likely they are to recommend your product. Given that 92% of consumers trust recommendations from friends and family [4], a high NPS in this group can fuel organic growth.
- Use Case Development Rate: Early adopters often find creative applications for your product beyond its intended purpose. Documenting these novel use cases can validate assumptions about your market and inspire future features.
Take Loom, for example. After launching on Product Hunt, they attracted 3,000 early adopters who provided essential feedback. This input allowed them to refine their product before scaling to a broader audience, eventually reaching 14 million users [4]. Similarly, Dropbox leveraged insights from early adopters to streamline its storage features, laying the groundwork for its widespread success [5].
Connecting Metrics to Strategy
The data and feedback from early adopters should directly influence your product roadmap and go-to-market strategy. Their behavior reveals which features deliver the most value and what messaging resonates with decision-makers. This intelligence is critical for refining your approach before scaling to a broader audience.
High-Growth Digital’s 90-Day Brand Implementation Sprint addresses this need by translating complex product capabilities into messaging that connects with early adopters and beyond. This approach is especially useful for technical founders, who may struggle to communicate their product’s value in straightforward business terms. Considering that 72% of consumers share positive experiences with at least six people [4], clear and compelling messaging can amplify your growth during this stage.
To maximize the value of early adopters, consider offering them exclusive perks. For example, grant them early access to new features, host private webinars to showcase advanced use cases, or create advisory groups where their input shapes the product’s direction. This not only strengthens their loyalty but also recognizes the professional risk they take by championing your product.
These insights lay the foundation for tackling the challenges of reaching the early majority.
Stage 3: Early Majority - Scaling Adoption
The early majority accounts for 34% of the market [3], representing the shift from niche adoption to widespread acceptance. These users are pragmatic - they’re not chasing the latest trends but waiting for solid proof that a product or technology delivers real, measurable results. Unlike early adopters, who are drawn to innovation, the early majority prioritizes practicality and clear benefits in their current workflows [1].
According to Whatfix, "The early majority are interested in technology but want proof of its effectiveness. These are the people who review product testimonials before making a purchase, and they quietly test out tools before committing. Case studies and real-life user stories trump generic promises of what a tool or program can do." [1]
This stage demands a shift in focus. Instead of early validation, success now hinges on achieving scalable, consistent growth. Let’s explore the metrics and strategies that cater to this group.
Metrics for Mainstream Integration
At this stage, metrics need to demonstrate more than just initial interest - they must show ongoing, scalable value.
- Adoption Velocity: This measures how quickly new users achieve meaningful milestones with your product. Track the percentage of users completing key actions within a set timeframe to gauge how effectively they’re integrating the solution into their workflows [3].
- Cross-Departmental Penetration and Workflow Integration: It’s not just about one team using the product - it’s about how broadly it’s adopted across an organization. The Workflow Integration Index evaluates how seamlessly your product fits into daily operations, from automated workflows to regular usage patterns.
- Product-Market Fit Measurement: Tools like the Sean Ellis test - asking users how disappointed they’d be if the product were no longer available - can reveal how deeply users value your solution. A score where over 40% of users say they’d be "very disappointed" is a strong indicator of traction [6]. Highlighting measurable workflow improvements and the number of companies actively using your product builds the credibility this group seeks [7].
Industry-Specific Considerations
Different industries have unique challenges and priorities when engaging the early majority. Tailoring your approach is essential.
- Enterprise SaaS: Focus on metrics like license utilization, feature adoption across various roles, and integration with existing systems. These users often require longer evaluation periods, so adjust your measurement windows to reflect their decision-making process.
- Biotech and Health Technology: Compliance and regulatory considerations dominate here. Track metrics related to data security, compliance workflows, and validation study participation. Progress in training modules and certifications can also provide a good measure of adoption.
- AI/ML Platforms: Early majority users in this space expect reliability across diverse use cases. Metrics like model accuracy improvements, data integration success rates, and time-to-insight help demonstrate that your tool works consistently with minimal customization.
For technical founders, translating complex technical achievements into business-focused insights is critical. Programs like High-Growth Digital’s 90-Day Brand Implementation Sprint are designed to bridge this gap, helping transform technical value into messaging that resonates with pragmatic business users.
Risk Mitigation Metrics
Early majority users value stability and reliability above all else. Metrics such as system uptime, error rates, and support ticket resolution times are essential to building trust. Additionally, tracking onboarding success and early user satisfaction can help identify and address potential adoption risks before they escalate.
This group’s preference for proven, reliable solutions underscores the importance of consistency. By focusing on delivering steady, dependable value rather than chasing flashy breakthroughs, you lay the groundwork for sustained, long-term growth.
Stage 4: Late Majority - Overcoming Resistance
The late majority, representing about 34% of the market, tends to adopt new technology only when avoiding it becomes a clear disadvantage [3]. This group is cautious by nature, requiring solid, data-backed evidence that a solution is reliable, essential, and fits seamlessly into their existing workflows. Addressing their concerns means focusing on metrics that directly tackle their risk aversion and demand for proof.
Tracking Risk-Averse Adoption
To gauge adoption within this group, it’s crucial to monitor metrics that address their specific concerns:
- Customer Support Efficiency: Keep an eye on support request volumes and resolution times to ensure users receive timely, proactive assistance.
- Training Completion and Retention Rates: Measure the success of onboarding programs by tracking completion rates and how well users retain key information for long-term success.
- Cost Justification Metrics: Use financial indicators like time-to-payback and total cost of ownership to provide clear, data-driven reasons for adopting the technology.
- Disruption Minimization Tracking: Monitor workflow interruptions, such as dips in productivity or rising error rates during transitions, to demonstrate minimal disruption.
- Control and Autonomy Indicators: Evaluate participation in pilot programs and responsiveness to feedback to ensure users feel involved and empowered during the change process.
- Peer Validation Metrics: Collect testimonials, case studies, and track peer-to-peer referrals to emphasize social proof and showcase successful implementations.
Addressing Barriers to Adoption
The resistance of the late majority often stems from understandable concerns about risk, disruption, and managing change. For instance, one hospital successfully overcame resistance to electronic medical records (EMR) by involving physicians in decision-making, offering thorough training, and showcasing early wins [8].
Recognizing that this group's hesitancy is rooted in legitimate worries allows businesses to build trust through tailored strategies. Highlighting strong support systems, clear cost advantages, minimal disruption, and peer validation can make all the difference when convincing this significant market segment to adopt new solutions.
Stage 5: Laggards - Measuring Mandatory Transitions
After the late majority cautiously embraces change, the final group - laggards - requires a distinct approach. These individuals, making up 16% of adopters, typically resist adopting new technology unless absolutely necessary [1][3]. Unlike others who may be motivated by curiosity or competitive advantage, laggards often wait until external forces, such as regulatory requirements or the obsolescence of their current systems, leave them with no other choice. To ensure full market adoption, it’s crucial to measure and manage these mandatory transitions effectively.
Key Metrics for Laggards
Since laggards are driven by external pressures, the metrics used to evaluate their adoption process must reflect this reality. Here are a few critical measures:
- Mandatory Transition Compliance Rate: Tracks how quickly laggards respond to required system changes or mandates. For instance, if a legacy system is being phased out, this metric can monitor the percentage of users who switch to the new system before the official end-of-support date. It highlights the urgency of their adoption behavior.
- Regulatory Adoption Velocity: Assesses how quickly laggards adapt to legal or regulatory requirements. This is especially valuable in industries with strict compliance deadlines, where external pressures often dictate the pace of adoption.
- Legacy System Dependency Ratio: Evaluates the share of users still relying on outdated systems compared to those who have transitioned to newer solutions. This helps identify users who may need additional support or resources to make the shift.
Balancing Costs and Benefits
Managing laggards presents unique challenges. They often require more resources to transition while offering lower immediate returns. However, the long-term advantages - such as better productivity, enhanced security, and reduced maintenance costs - can make the effort worthwhile [9]. The key lies in strategically balancing the costs and benefits.
- Support Cost Per Laggard: Calculates the total expenses involved in transitioning resistant users, including training, one-on-one support, and any necessary customizations.
- Transition Timeline Optimization: Strikes a balance between speed and cost. Pushing for rapid transitions might drive up costs and resistance, while delays can postpone the benefits of adoption.
- Legacy Maintenance Burden: Compares the ongoing costs of maintaining outdated systems with the potential savings from a complete migration. Often, funds spent on keeping legacy systems operational could be better used to encourage and support adoption.
- Incremental Value Capture: Measures the business benefits gained as laggards complete their transitions. Even if they never fully embrace the new technology, their participation is critical to achieving organizational transformation.
Because laggards are often hesitant due to fear or uncertainty, education and clear communication [10] are vital in easing their concerns. Businesses that invest in patient, tailored support often find that once laggards make the transition, they become dependable, long-term users. With this, the stage-by-stage metric framework for adoption is complete.
Advanced Analytics for Adoption Forecasting
Advanced analytics transforms adoption data into actionable market predictions. The growing focus on predictive analytics highlights its role in shaping technology adoption strategies. These sophisticated methods go beyond basic metrics, offering deeper insights for every stage of the adoption process.
Predictive Models and Tools
Adoption forecasting often relies on S-Curve Projection Algorithms. Two key models dominate this space:
- The Modified Gaussian model predicts sharp growth curves, showing rapid early adoption followed by a plateau. This is particularly useful for pinpointing early market trends and key intervention points.
- The Logistic model, on the other hand, illustrates a steady and continuous growth trajectory, ideal for long-term strategy and trend planning [14].
Using a mix of algorithms can capture a wider range of adoption behaviors. For example:
- Random forest models handle complex variable interactions effectively.
- Gradient boosting excels in delivering accurate, time-sensitive predictions.
- Linear regression provides a reliable baseline for trend analysis.
- Logistic regression helps classify adoption likelihood across various user groups [12].
Another critical tool is Technology Readiness Level (TRL) Scoring, which evaluates product maturity and readiness for adoption. The TRL scale spans from 1 (basic principles observed) to 9 (fully operational systems) [11]. Companies can use this scale to align their technology's maturity with historical adoption trends, helping to predict market entry timing and resource allocation.
| TRL Level | Description | Adoption Readiness |
|---|---|---|
| 1-3 | Basic research and proof of concept | Limited to innovators |
| 4-6 | Validation and demonstration | Early adopter engagement |
| 7-9 | Operational system | Ready for mainstream markets |
Early Warning Systems are also essential for identifying market saturation before it affects growth. These systems analyze diverse data streams - like acquisition costs, engagement metrics, and competitor activity - to detect when adoption rates may begin to slow. For instance, predictive maintenance systems have cut unplanned downtime by over 40% in pilot programs [13].
Key data points for predictive models include customer surveys, churn rates, market penetration stats, and operational performance metrics [15]. Machine learning can highlight potential churn by analyzing engagement with new features or service issues, while regression models can measure the impact of new features on customer satisfaction or retention [15].
Finally, Real-time Analytics Integration ensures forecasts are continuously updated. This allows businesses to adapt their strategies quickly to shifting market conditions, maintaining a competitive edge.
High-Growth Digital's Growth Systems
High-Growth Digital applies these advanced analytics to create practical growth systems. Their approach helps technical founders align analytics with adoption forecasting through initiatives like the 90-Day Brand Implementation Sprint, which integrates analytics into market strategies.
Their Technical Value Architecture links product features to adoption metrics across the five stages of the adoption curve. This helps engineering-led companies understand which features drive adoption, from innovators experimenting with new technology to laggards meeting compliance requirements.
The Brand Translation System uses predictive modeling to refine messaging for different adopter groups. By analyzing adoption patterns in industries like biotech, AI/ML, enterprise SaaS, and health tech, they craft models tailored to specific market behaviors.
The Sustainable Growth System focuses on long-term forecasting. This includes early warning systems for saturation, scenario analysis for various growth paths, and real-time monitoring to refine predictions based on market feedback.
Companies leveraging AI for real-time insights and automated survey analysis could see growth of 30–40% over the next 3–5 years [15]. High-Growth Digital ensures technical founders can tap into this potential by building analytics systems that evolve with their adoption curve, from early innovators to full market penetration.
Their methods address a key challenge: 78% of manufacturing executives rank predictive analytics as "important" or "critically important" for maintaining a competitive edge in the next five years [13]. By focusing on technical industries, High-Growth Digital tailors its analytics solutions to the unique adoption patterns and market dynamics faced by engineering-led companies.
Conclusion: Unified Metrics for Long-Term Growth
Bringing metrics together across the technology adoption curve transforms scattered data points into a cohesive growth strategy. This approach builds on the metric foundations we've covered. The most thriving tech companies understand that every stage of adoption demands its own measurement methods - but the real magic happens when these metrics are connected into a unified system.
Key Takeaways
Companies that closely monitor adoption metrics can see up to 30% higher ROI on their digital initiatives [17]. It’s not just about gathering numbers; it’s about interpreting what those numbers reveal at every stage of user adoption.
Your metrics should answer four essential questions: Who is adopting your product, what features they find most valuable, when adoption happens, and how long those users stick around [2]. This applies whether you're analyzing early adopters exploring new features or late adopters gradually embracing the basics.
Even small improvements in adoption rates can lead to noticeable revenue growth. For instance, a well-designed UI/UX that aligns with user behavior can boost engagement by up to 25% [17]. In the SaaS world, while the median product activation rate hovers around 17%, top-performing companies achieve rates as high as 65% [16]. Additionally, product stickiness - often between 13% and 20% [16] - shows there's ample room for improvement when metrics are systematically tracked.
Next Steps for Technical Founders
For technical founders, the challenge lies in linking technical innovations to market impact. With nearly 30,000 new products launching each year and 95% of them failing [18], success often hinges on bridging the gap between technical prowess and market readiness.
High-Growth Digital’s 90-Day Brand Implementation Sprint offers a solution by combining Technical Value Architecture with detailed adoption metrics. This helps engineering-driven companies pinpoint which features are driving user adoption at each stage. These insights reinforce the importance of aligning technical excellence with market needs.
To move beyond isolated metrics, start by tracking early conversion and activation rates while keeping an eye on usage frequency and customer lifetime value as your product scales. Tools like in-app messaging for feature announcements and targeted email campaigns to re-engage inactive users can also enhance adoption [2].
FAQs
How can companies successfully shift from serving early adopters to reaching the early majority in the technology adoption curve?
To move successfully from early adopters to the early majority, businesses need to prioritize earning trust and demonstrating tangible results. This group tends to be more cautious, often seeking solid proof that a product is dependable and delivers on its promises. Sharing testimonials, case studies, and measurable outcomes from early adopters can go a long way in building credibility and easing any doubts.
Equally important is understanding the specific needs and concerns of the early majority. Shape your messaging to focus on what matters most to them - things like simplicity, affordability, and long-term value. By offering clear, practical examples of how your product addresses everyday challenges, you can make it far more appealing to this audience.
How can businesses reduce resistance and drive adoption among the late majority and laggards?
To win over the late majority and laggards, businesses need to focus on building trust and addressing their specific concerns. One way to do this is by offering clear and accessible support - think training sessions, step-by-step guides, or even video tutorials. These resources can make adopting new technology feel less intimidating and more manageable.
It’s also important to highlight the product’s stability and track record. Sharing peer testimonials, real-world case studies, and other forms of social proof can go a long way in reassuring hesitant users that the technology is reliable and worth their time. On top of that, offering incentives like discounts or extended free trials can help reduce the perceived risk and encourage them to give it a try.
By combining education, trust-building efforts, and attractive incentives, businesses can close the gap and bring even the most cautious adopters on board.
How can predictive analytics improve forecasting and decision-making across the technology adoption curve?
Predictive analytics plays a key role in improving forecasting and decision-making at every stage of the technology adoption curve. By leveraging historical data, it helps organizations anticipate user behavior and emerging trends, offering valuable insights into adopter categories like innovators, early adopters, and laggards. This allows businesses to fine-tune their strategies to meet the unique needs of each group.
Take demand forecasting as an example. Predictive models can identify potential shifts in demand, helping businesses allocate resources more effectively and tailor their marketing efforts. This forward-thinking approach ensures that products are available when customers need them, boosting satisfaction and making the adoption process smoother. The result? A more streamlined path to growth that benefits both companies and their customers.